Data Interpretation
Data interpretation is a process that benefits from collaboration between geoscience disciplines. Geophysics data can be interpreted in isolation, at times there could be justification, but ideally geophysical interpretation should be conducted alongside geologic and geochemical data. In the images below the magnetic data have been presented as 3D relief (like topography) and the K-Th-U ternary image from the radiometric data are draped over the magnetic surface. The data are from the Search III Geoscience BC survey.
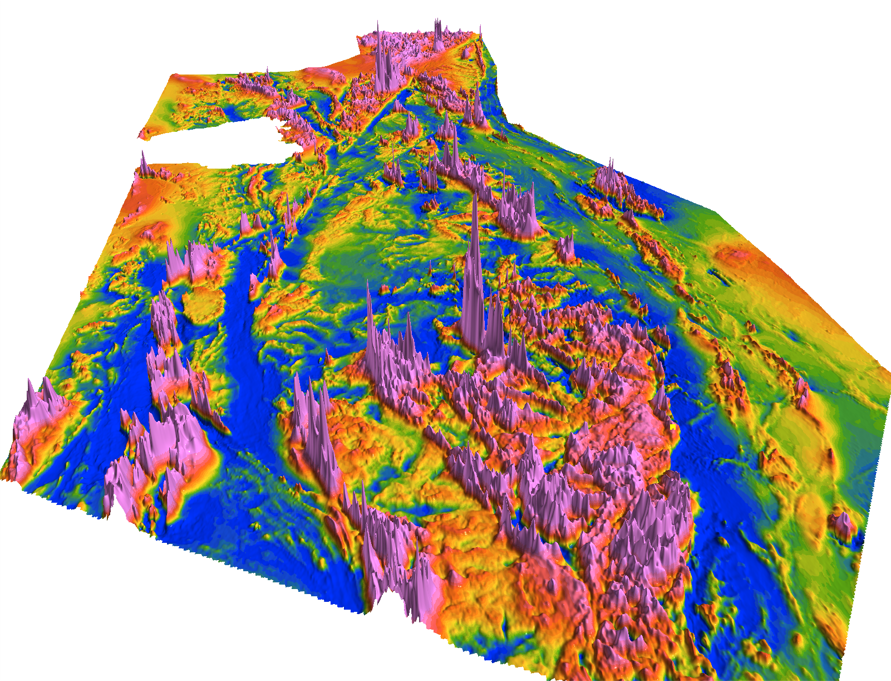
3D magnetic relief
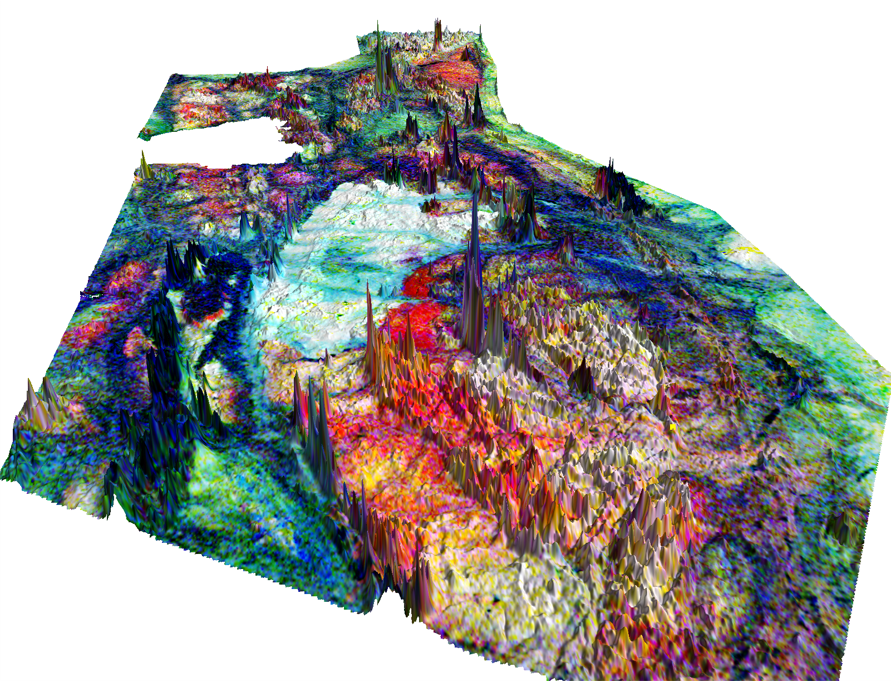
Draped radiometric ternary over 3D magnetic relief
Data clustering is a useful means of assessing relationships between various data. The two input data are left and middle and the resulting clustering shown on the right.
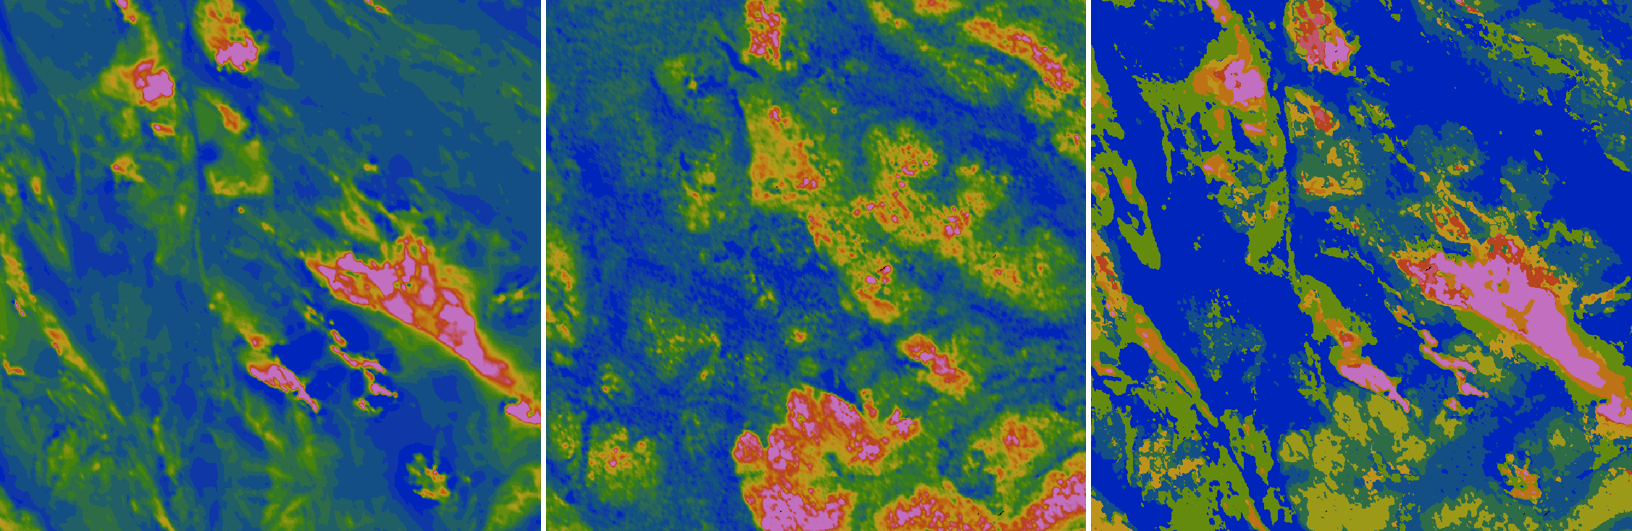
Example of K-means clustering (Right image) of two input data types.
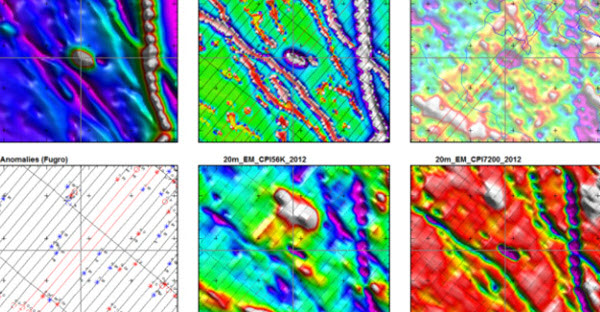
Example of a target compilation summarizing all available data. A PDF document or image is created for each target.
An interpreters natural tendency is to look for targets in regions of known mineral showings. This is not a bad thing as “closology” often works very well. However, it is important to understand and be aware this bias (keeping in check that it is possible to see what we want or hope to see) as well as being willing to think outside the near-mine scale. Exploration targeting generally takes multiple passes through integrated data sets. The more data are integrated, the better they can illuminate conceptual models and minimize the inherent risk in exploration. It is important to root one’s thinking in the mechanics of mineral systems. How did they get there? By what processes? What are the by-products and how do they affect rock physical properties such as susceptibility (i.e. magnetic mineral destruction due to chemical and thermal alteration effects), resistivity/chargeability and density.
Ternary magnetic image from Search II airborne survey by Geoscience BC.
Explorationists should consider that all traditional components of generalized deposit models may not be present in all instances; how will this affect targeting? Geoscience data integration promotes a collaborative working environment: geologists help guide geophysicists efforts by helping to constrain and promote interpretations within the realms “geologic” reality and providing straightforward geologic models that can be attributed to rock property contrasts and geophysicists support geology and geochemistry with the ability to help map geology and alteration by connecting the dots within their data sets and allow them to target at depth and undercover.
Lineament Analysis
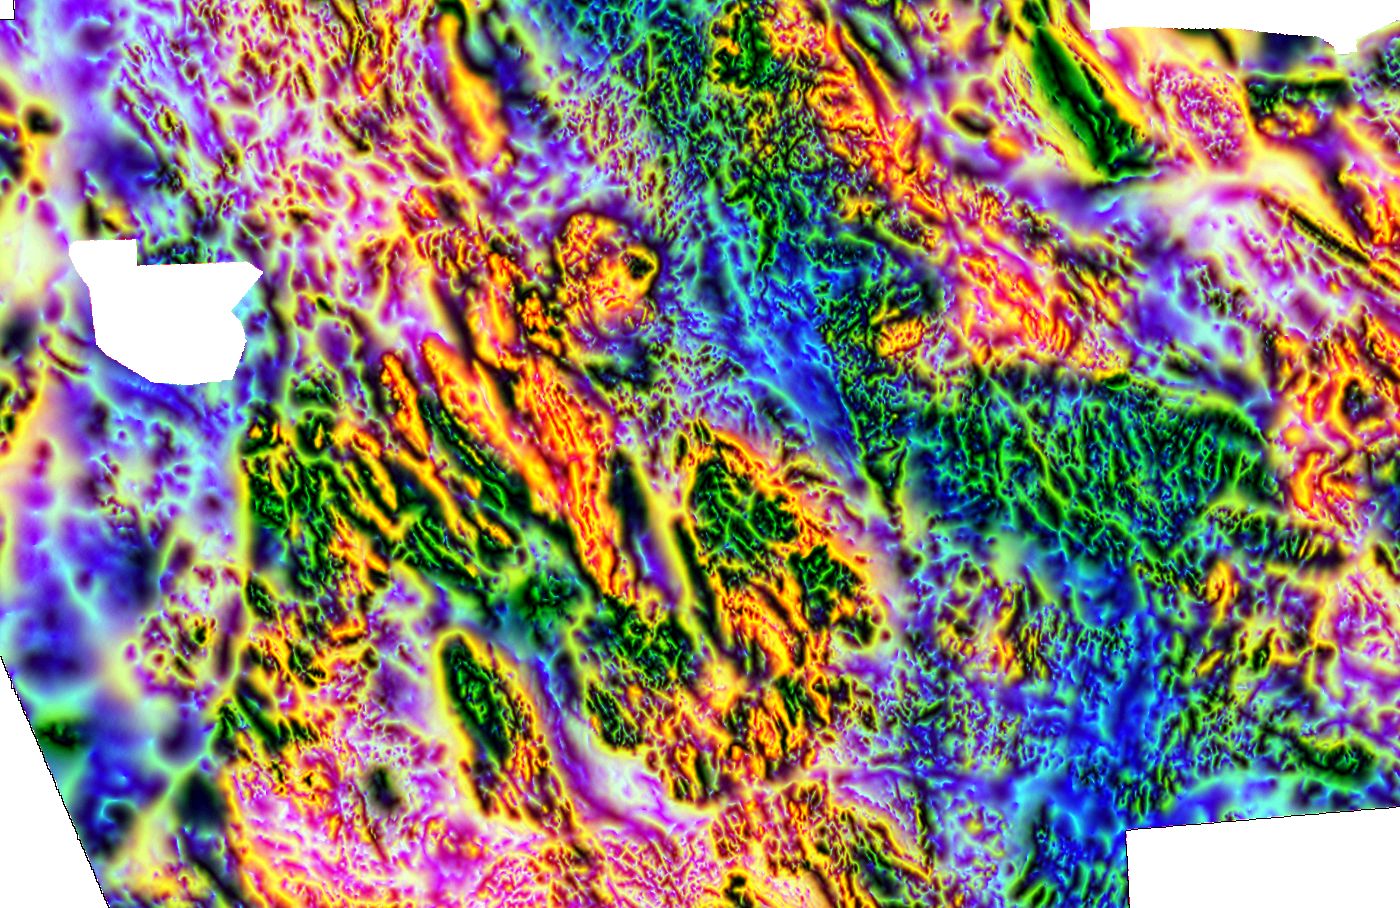
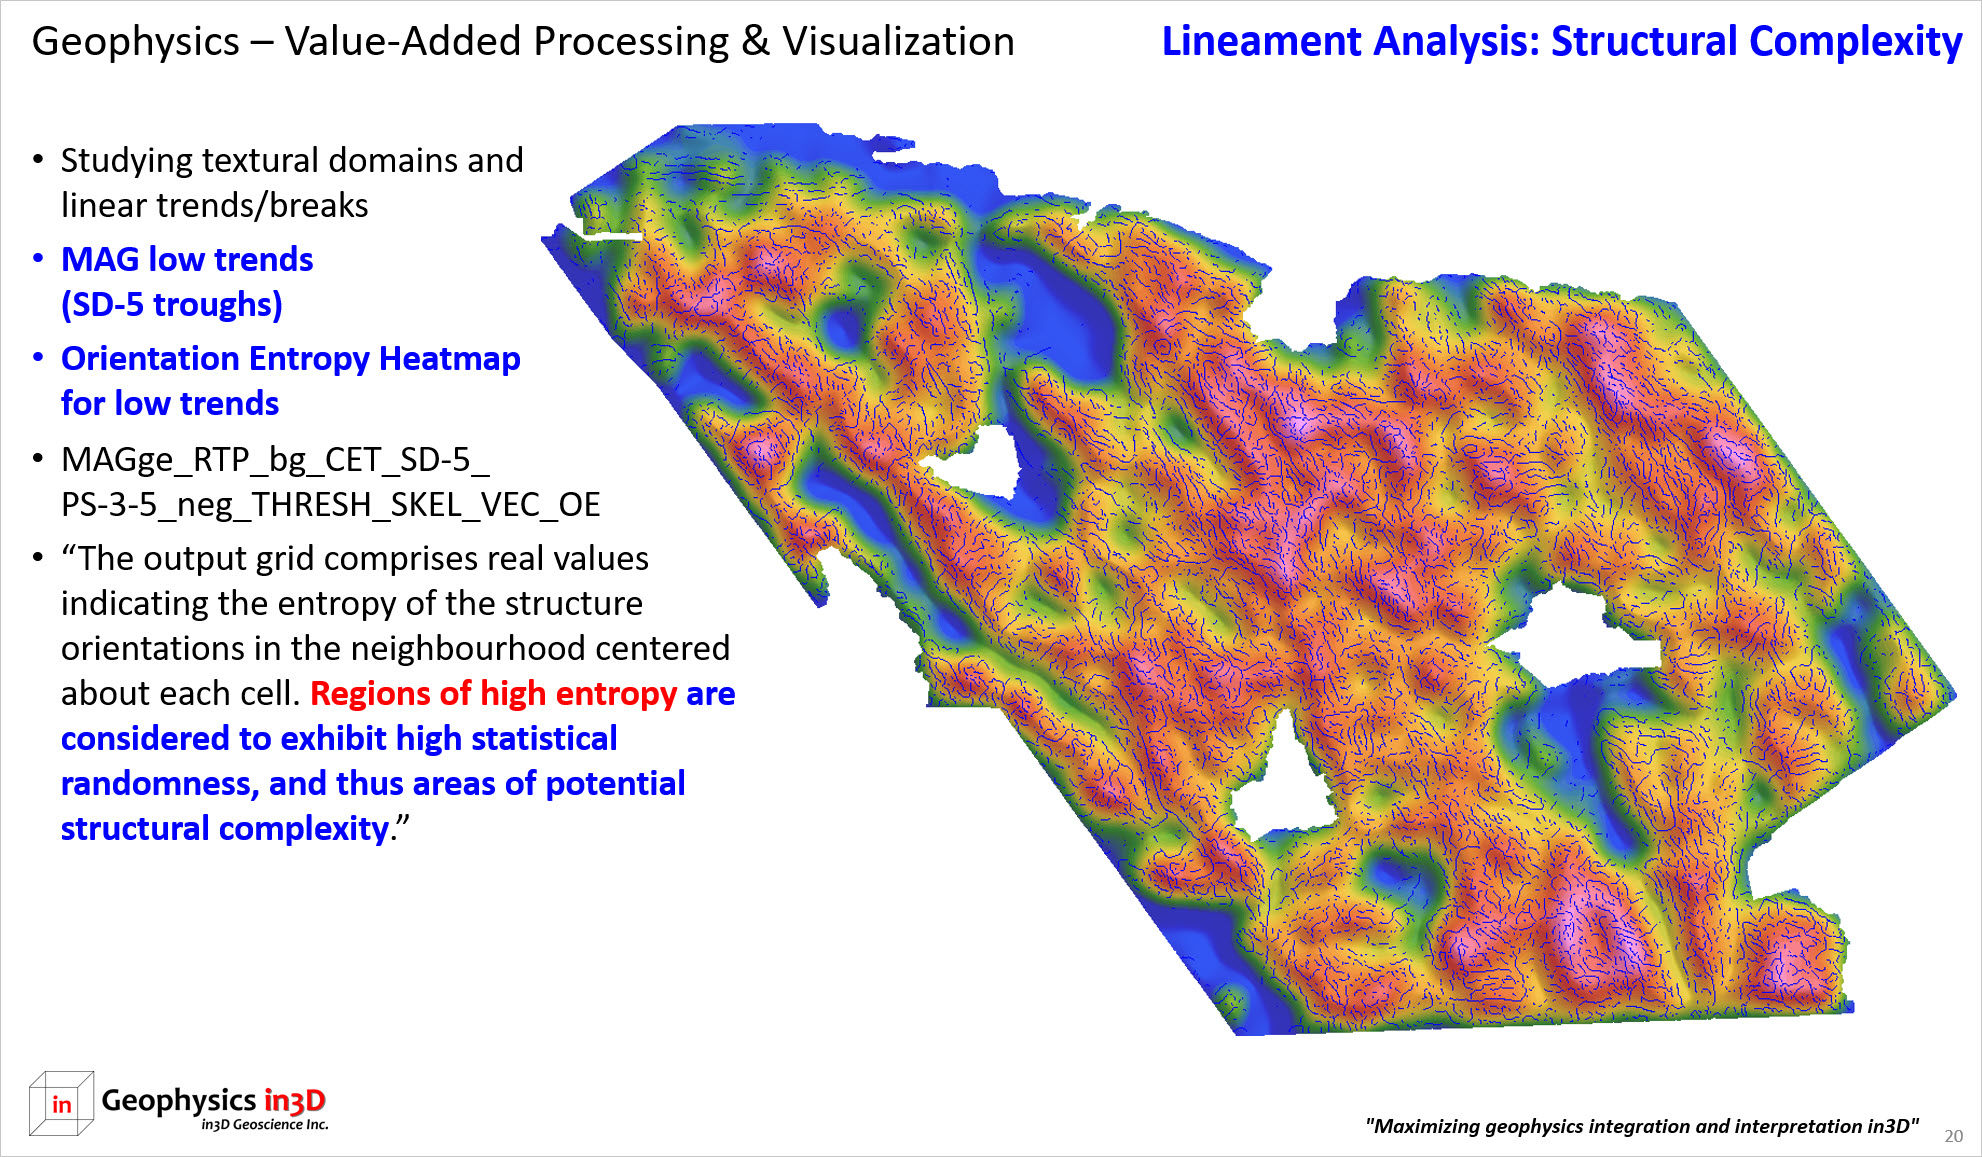
Automated and manual lineament analysis is a helpful tool in using geophysics to assist geologic mapping. In the following examples lineament analysis was conducted using phase symmetry analysis in the Geosoft CET module. The analysis is based on the scale or wavelength of responses of interest and was performed on the magnetic highs and lows. Automated lineament analysis is relatively unbiased, but verification is still required and additional manual interpretation is recommended to fully resolve features.

The image below is the assessment of structural complexity. Regions of high entropy are considered to exhibit high statistical randomness and thus areas of potential structural complexity. The black lines are magnetic low lineaments the colour grid is the orientation entropy Heatmap for magnetic lows.
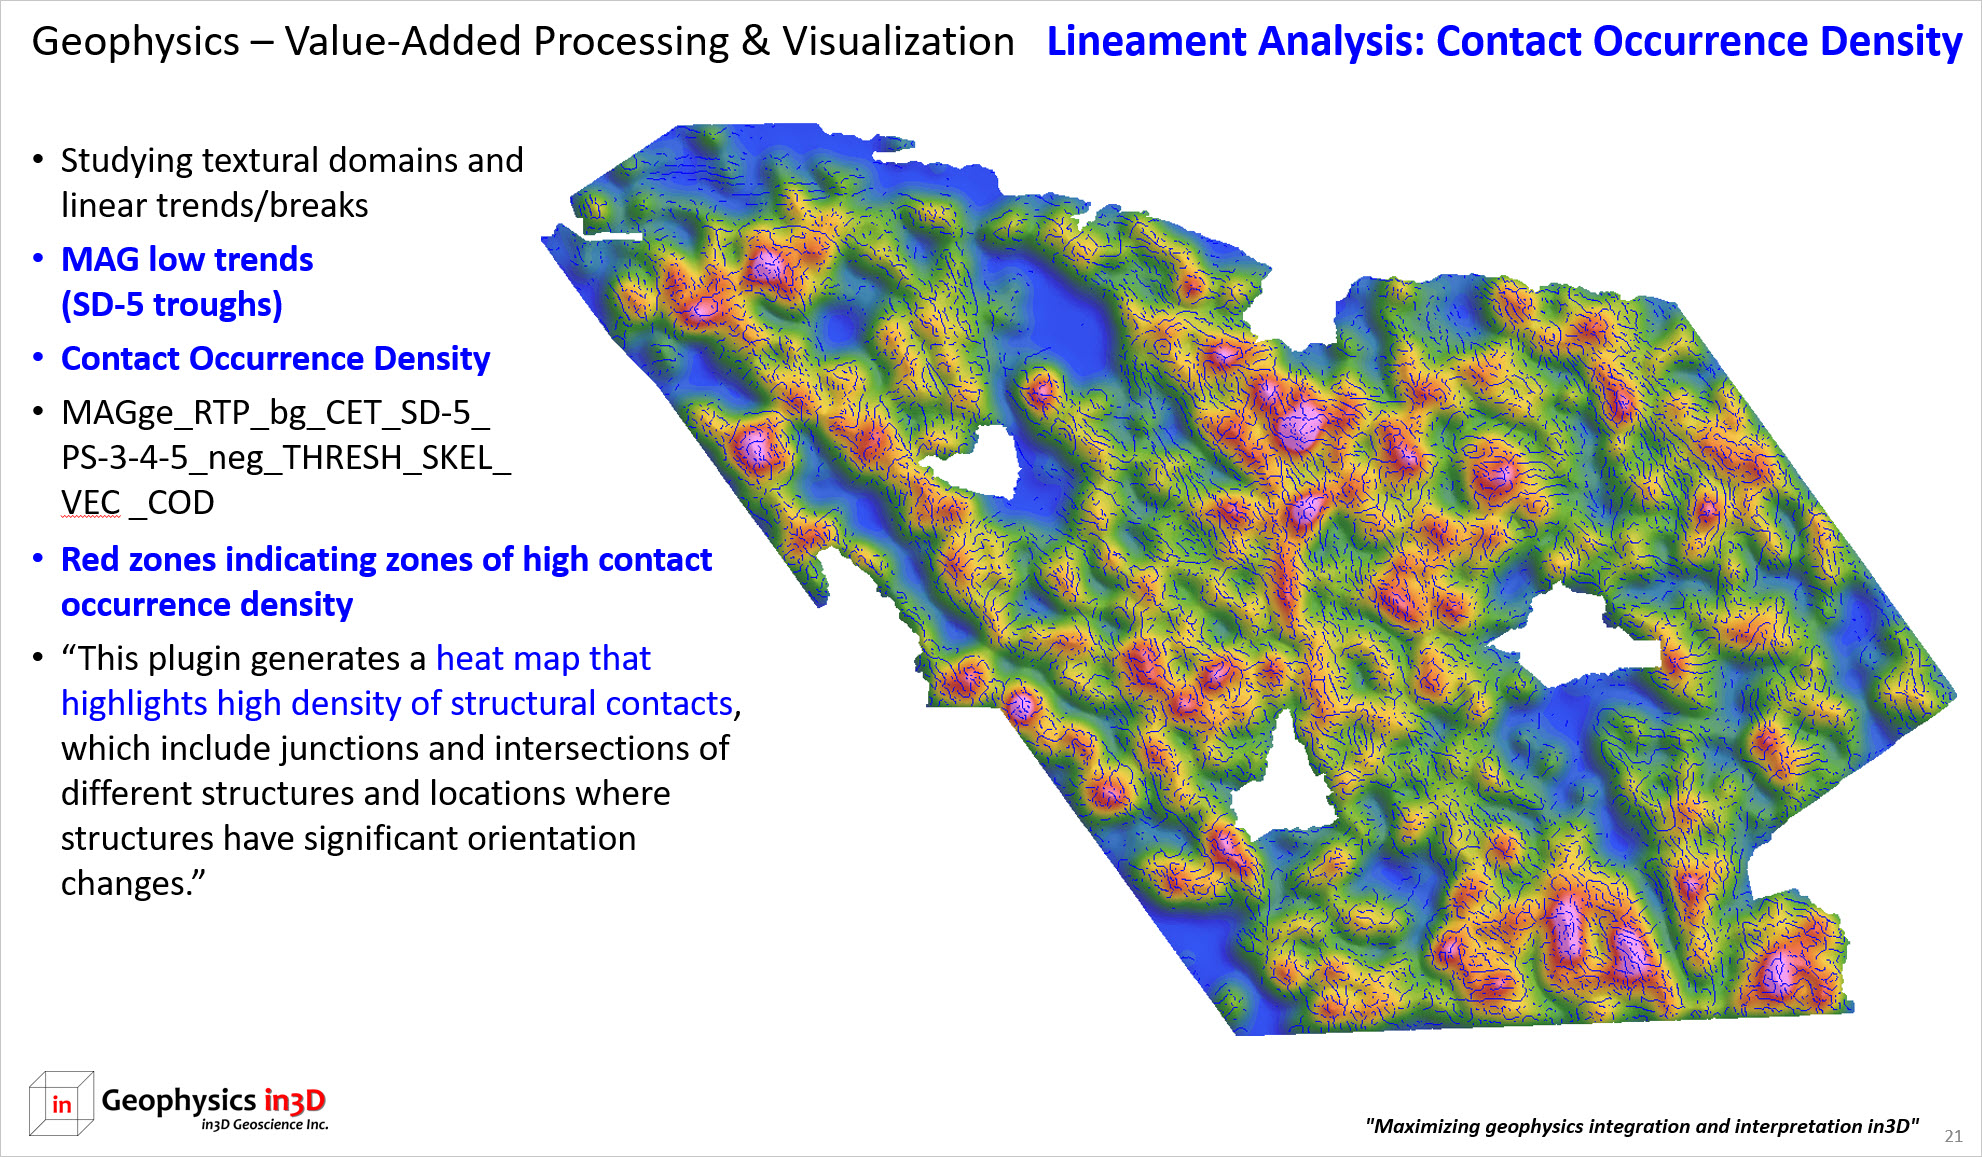
Contact occurrence density generates a heat map that highlights regions of high density of structural contacts. This includes junctions and intersections of different structures and notes locations where structures have significant orientation changes.
previous page: Rock Property Contrasts
next page: Targeting & Drilling