Data QC
Processing & Visualization
Data QC
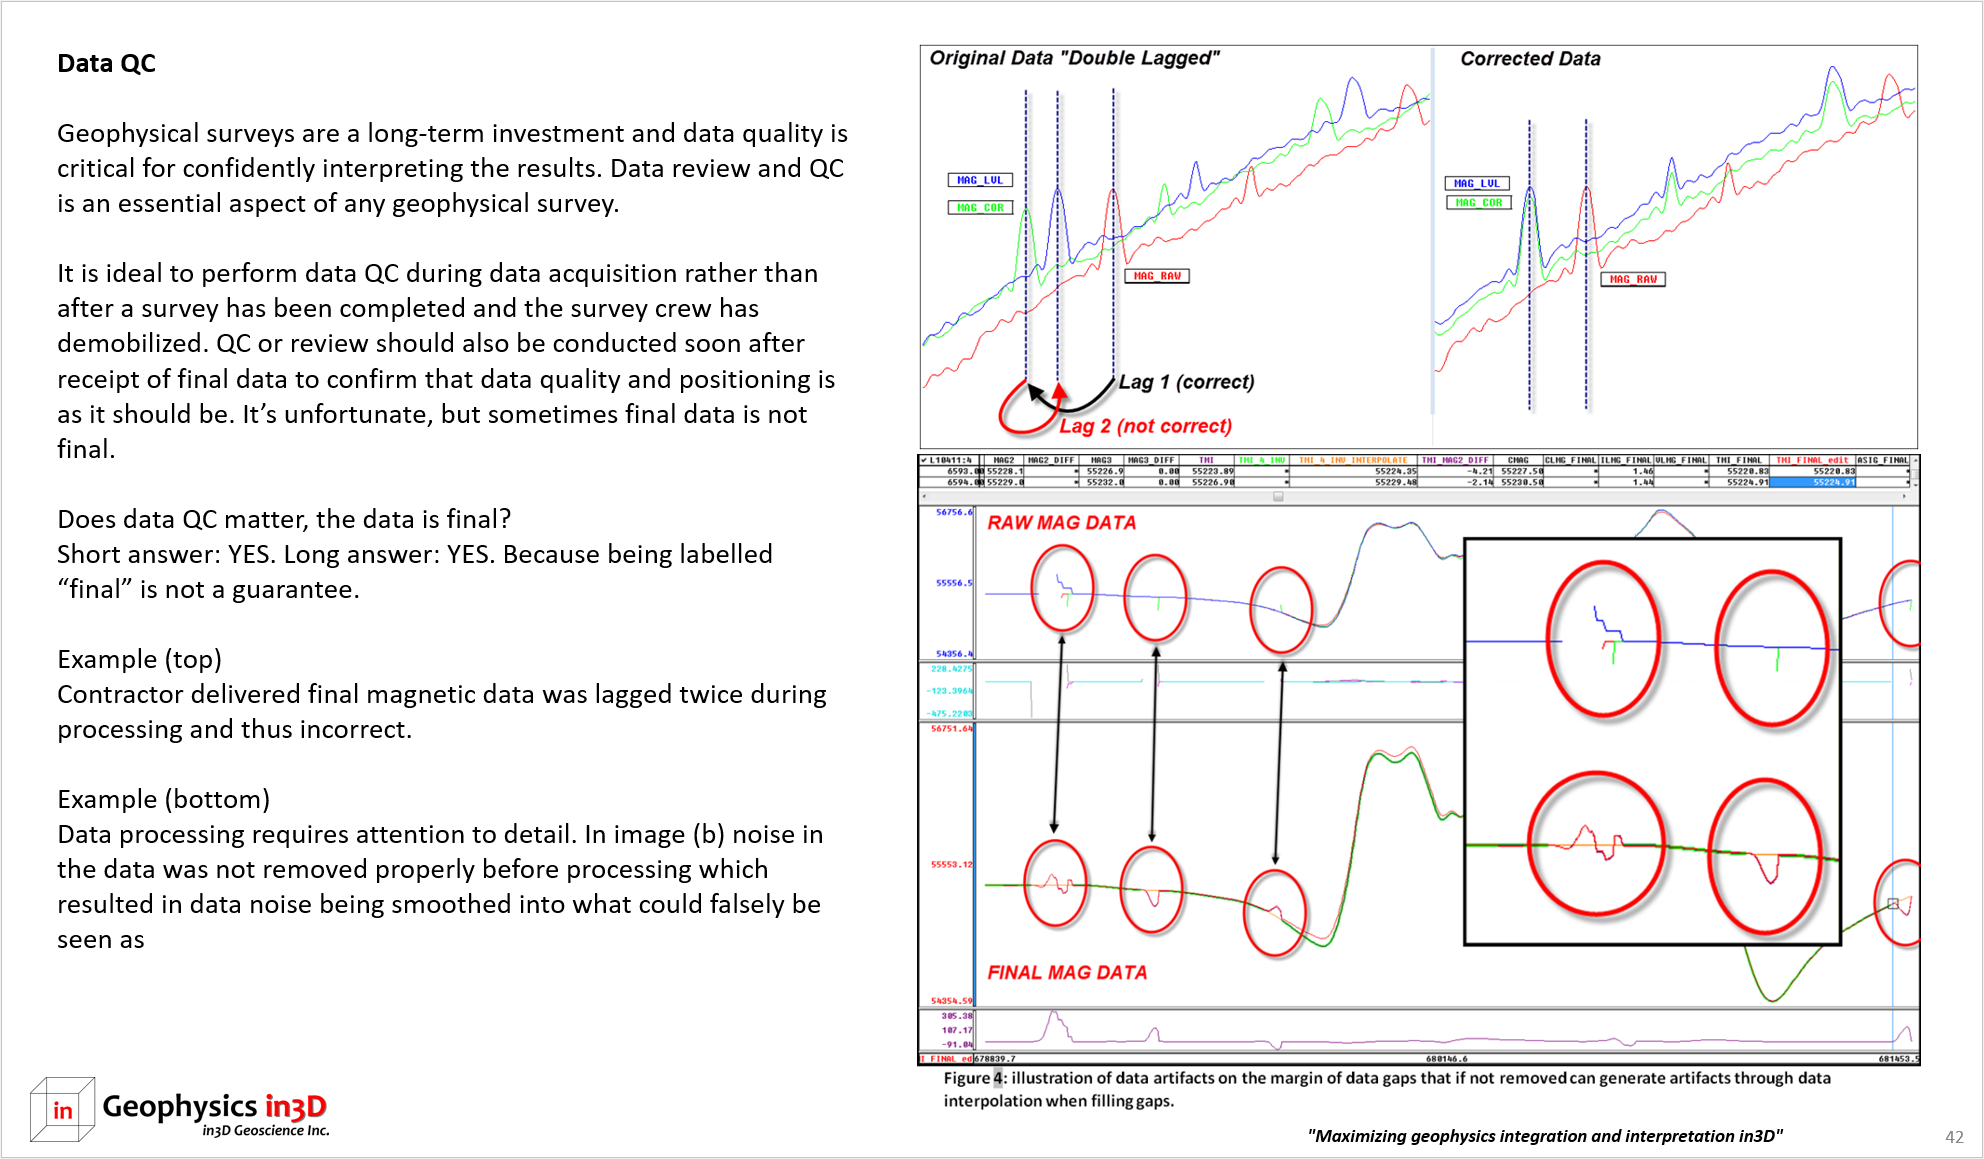
Geophysical surveys are a long term investment and data quality is critical for confidently interpreting the results. Data review and QC is an essential aspect of any geophysical survey.
It is ideal to perform data QC during data acquisition rather than after a survey has been completed and the survey crew has demobilized. QC or review should also be conducted soon after receipt of final data to confirm that data quality and positioning is as it should be. It’s unfortunate, but sometimes final data is not final.
Interested in more examples of Data QC please have a look at these Blog posts:
Geophysical Data: know your data – add value NOT artifacts
Geophysical Data QC: avoiding a mountainous mistake
Data Visualization
Data visualization is a key component of building a data compilation. Numerous enhancements can be achieved from individual data sets or combinations. Visualization options are customized to each project with respect to the data available. Multiple data types may be compared using ternary images or clustering routines such as K-means.
We strive to visually present data in a manner that can almost speak for itself and minimizes the need for verbose written observations of data properties.
Geophysical data should be assessed to see if improvements can be made to contractor deliverables or additional value-added products produced (right image). In the example image, re-gridding of the data using a smaller cell size and different gridding algorithm produces much more detail in the left image than can be seen in the original contractor deliverables in the right image. The ability to map and understand the geology has been improved with a basic, low-cost review of the data and its resolution abilities. Profile data are another means of improving the resolution of data. Profile data are plotted at the original measurement resolution (3 m for example) versus gritting resolution that might be 20 or 25 m in this particular case (1/5 or 1/4 of survey line spacing). The profile responses will show data character much more clearly than gridded data can achieve.
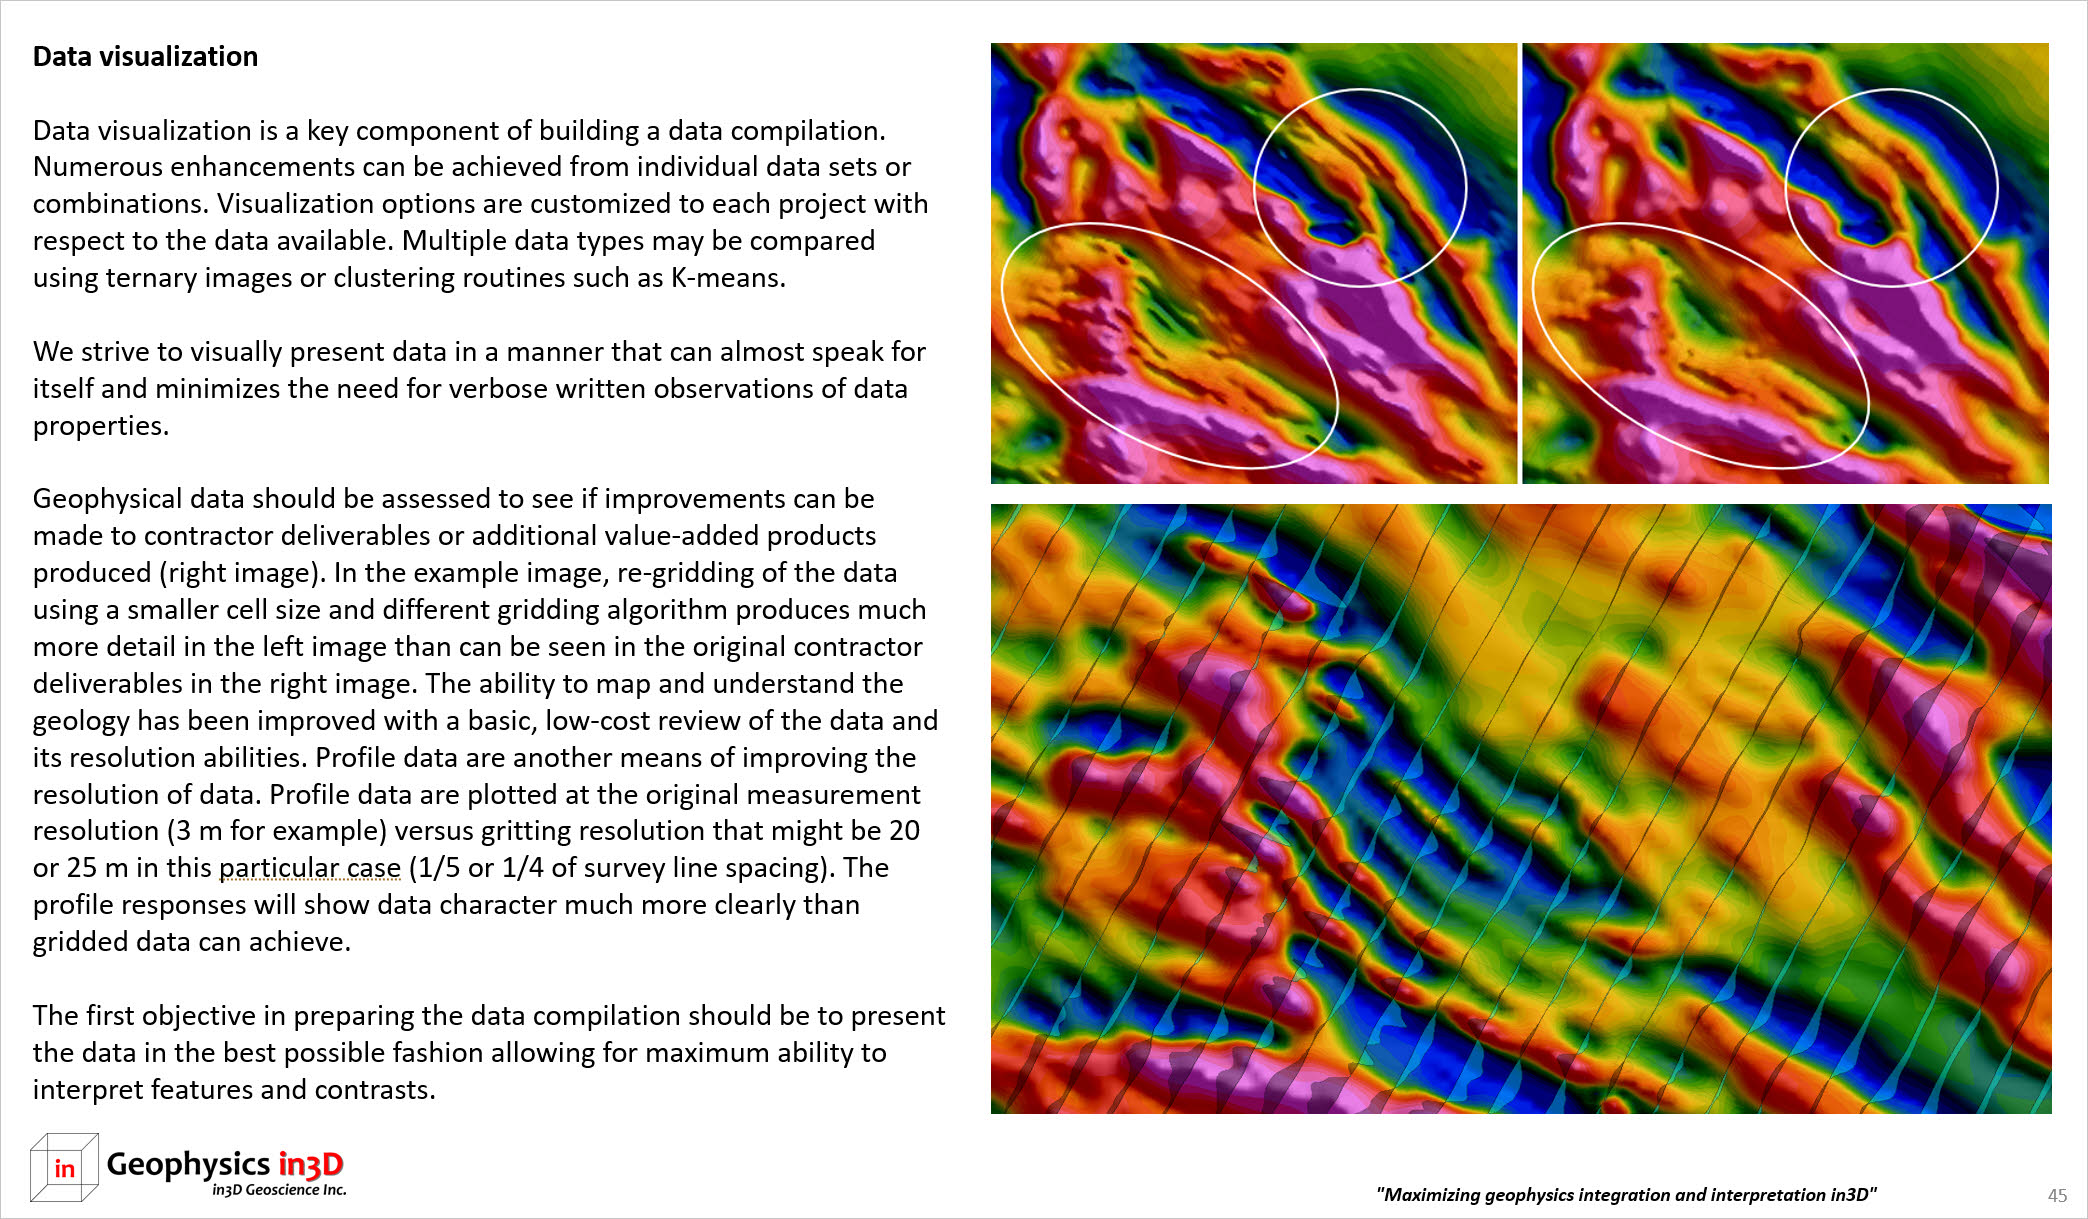
The first objective in preparing the data compilation should be to present the data in the best possible fashion allowing for maximum ability to interpret features and contrasts.
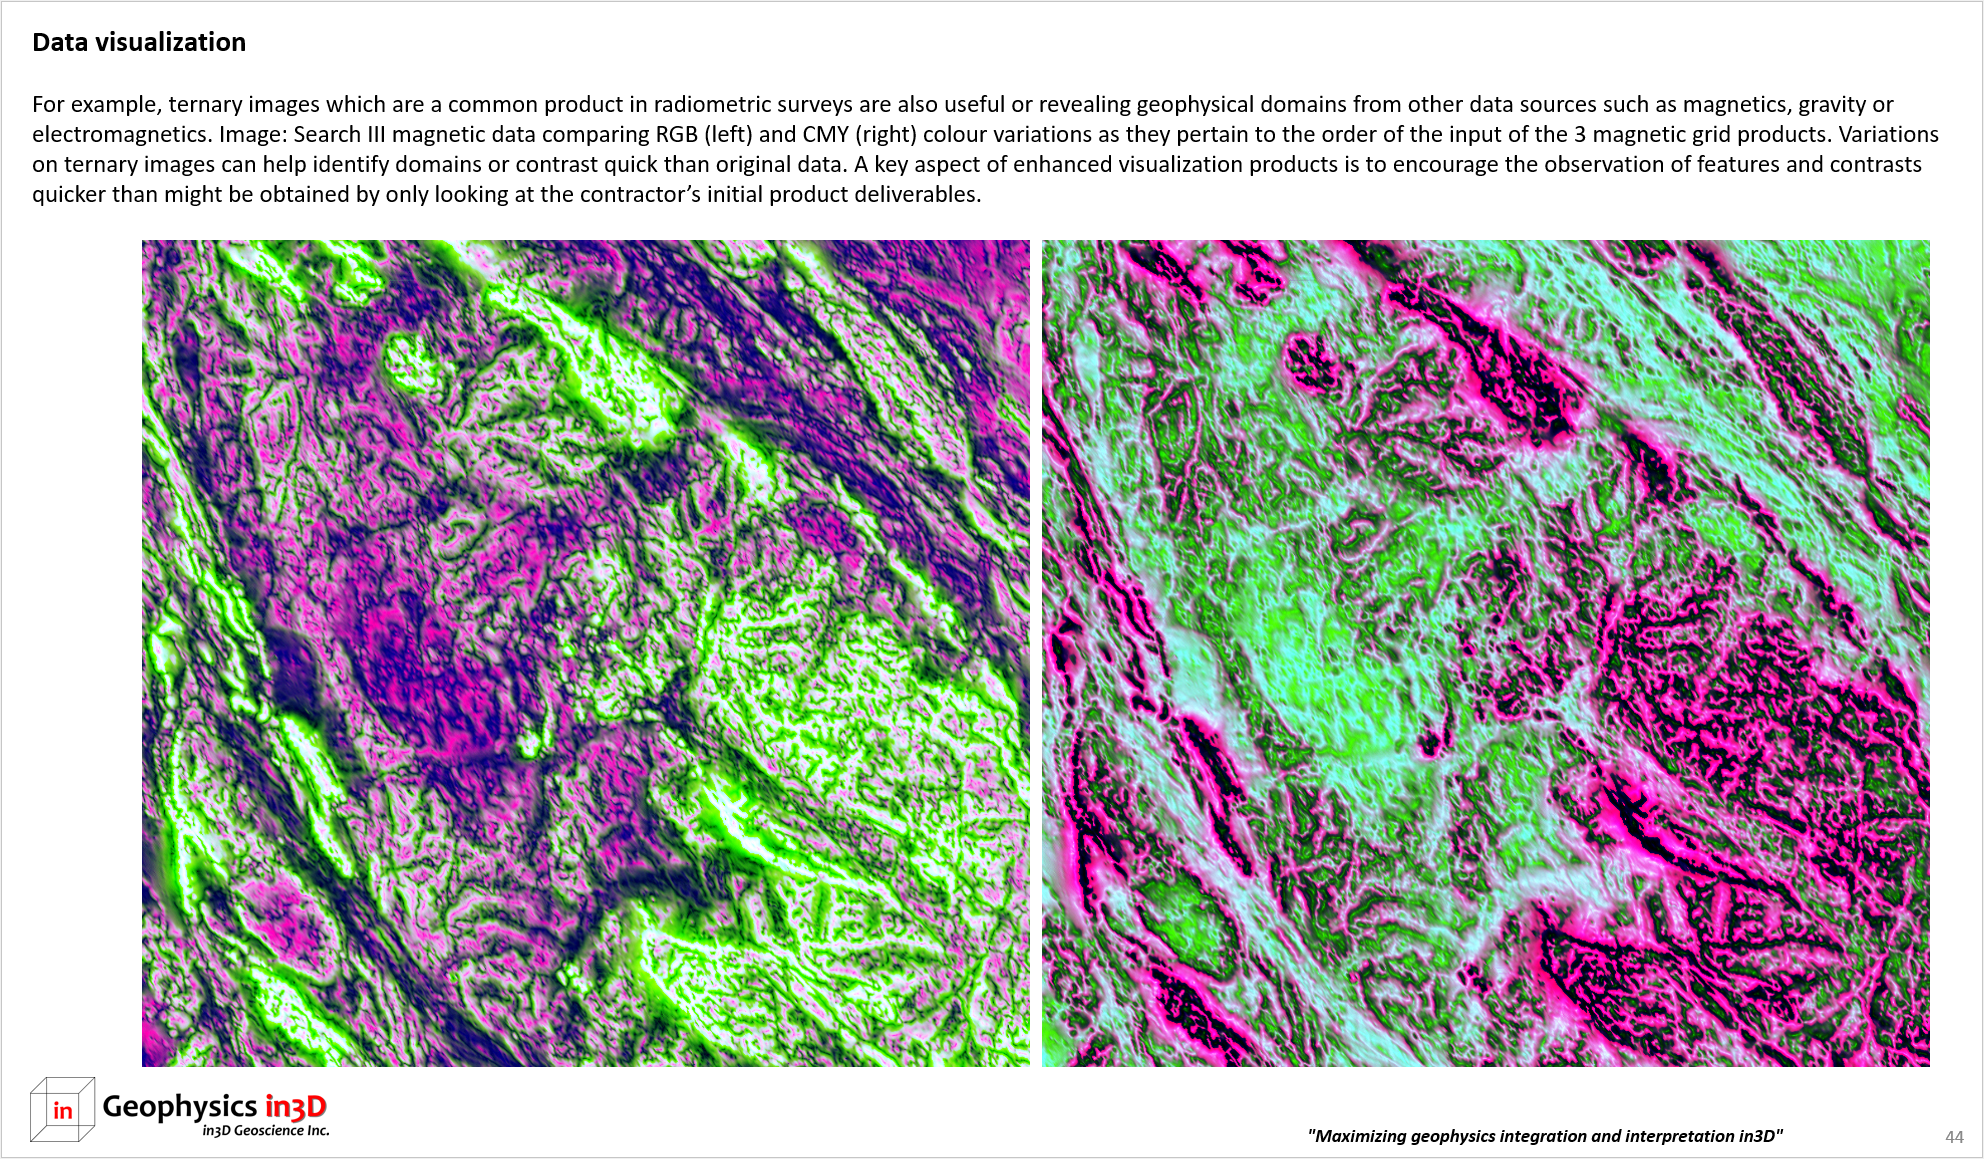
Preparing geophysical data for optimal observational value (aka interpretation) takes time and experimentation. Many products can be the same or variants, but often the data are assessed and presented in a manner unique to each project. For example, ternary images which are a common product in radiometric surveys are also useful for revealing geophysical domains from other data sources such as magnetics, gravity or electromagnetics. Image: Geoscience BC's Search III magnetic data is shown comparing RGB (left) and CMY (right) colour variations as they pertain to the order of the input of the 3 magnetic grid products. Variations on ternary images can help identify domains or contrasts quicker than original individual data grids. A key aspect of enhanced visualization products is to encourage the observation of features and contrasts quicker than might be obtained by only looking at the contractor’s initial product deliverables.
previous page: Survey Planning
next page: Data Modelling